Scientific Poster
>
Femtomolar-Detection-Antisense-Oligo-Using-Electrochemiluminescence-AAPS-2021
Highly Reproducible Femtomolar Detection of an Antisense Oligo in Human Plasma Using Electrochemiluminescence
AAPS 2021 Conference
Download ↓
PURPOSE
There has been a rapid rise in the number of antisense oligonucleotide (ASO) therapeutics being developed to regulate the expression of genes associated with metabolic, neurologic, cardiovascular, and other diseases. These modified DNA or RNA molecules are usually shorter than 30 nucleotides and dosed at low levels to minimize toxicity, making them difficult to measure in vivo. HPLC-MS/MS and hybridization ELISA are used to detect ASOs but these techniques lack the femtomolar sensitivity needed to assess the full pharmacokinetic profile of ASOs in biological matrices.
 View More
 View Less
METHODS
MSD’s electrochemiluminescence detection technology uses SULFO-TAG labels that emit light upon electrochemical stimulation initiated at the electrode surfaces of MULTI-ARRAY and MULTI-SPOT microplates.
 Electrochemiluminescence Technology
-
Minimal non-specific background and strong responses to analyte yield high signal-to-background ratios.
-
The stimulation mechanism (electricity) is decoupled from the response (light signal), minimizing matrix interference.
-
Only labels bound near the electrode surface are excited, enabling non-washed assays.
-
Labels are stable, non-radioactive, and directly conjugated to biological molecules.
-
Emission at ~620 nm eliminates problems with color quenching.
-
Multiple rounds of label excitation and emission enhance light levels and improve sensitivity.
-
Surface coatings can be customized
Basis of the N-PLEX platform
N-PTechnical Overview and Calibration Curves (Two-Probe Approach)LEX plates contain 10 unique capture oligonucleotides that are bound to their corresponding spots on the electrode surface. Detection of a nucleic acid sequence of interest is accomplished by hybridization of one or more probes with sequence complementary to these capture oligos and the nucleic acid of interest, followed by detection via electrochemiluminescence (i.e. biotin/streptavidin SULFO-TAG interactions). Blocking, hybridization, and detection are completed using MSD proprietary buffers and diluents.
ASO Assay Development
Two assays were developed for detecting unconjugated and conjugated forms of a promising PCSK9-ASO drug candidate in human plasma on the N-PLEX platform.
Plasma samples
Human plasma samples in sodium citrate were purchased from BioIVT. For all experiments involving the use of plasma, exogenous ASO was spiked into human plasma and serially diluted in the same matrix to generate calibration curves.
ASO detection via two-probe approach
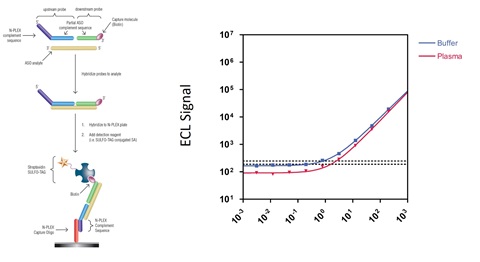
The two-probe detection assay used probes that were complementary to the nucleotides of one half of the ASO. One probe contained a spot-specific sequence at the 5′ end that allowed for hybridization to the N-PLEX plates, while the other probe contained a biotin on the 3′ end for detection. The probes were hybridized to the ASO and then to spot-specific capture oligos on the N-PLEX plates. Streptavidin-bound SULFO-TAG was then used for detection of the captured ASO.
ASO detection via RNase protection assay
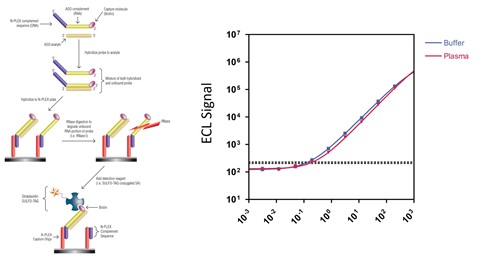
The RNase protection assay (RPA) utilized a single chimeric probe for the detection of the ASO on the N-PLEX platform. This chimeric probe contained a 5′ DNA sequence that was complementary to the plate-bound capture oligo followed by an RNA portion that was complementary to the ASO and a biotin on the 3′ end for detection via streptavidin-bound SULFO-TAG. Plasma samples were pretreated with RNAsecure reagent (ThermoFisher Scientific) and heated to 60°C for 10 minutes to inactivate endogenous RNases. Once the probe was hybridized to both the ASO and the plate, an RNase cocktail was added to degrade any single-stranded RNA sequence. Therefore, any RNA in the probe not fully protected by the ASO would be degraded and the biotin released from the DNA portion of the probe, rendering it undetectable via streptavidin-bound SULFO-TAG.
RESULTS
Technical Overview and Calibration Curves (Two-Probe Approach)

Figure 1. Schematic for ASO detection via the two-probe approach (a) and comparison of calibration curves generated in buffer or human plasma (b).
Table 1. The unconjugated and conjugated forms of the ASO drug were mixed at different ratios to assess whether any conjugation bias was observed using the two-probe approach. The signals derived from the mixtures were compared to a 50/50 mix normalization.
Dilution Linearity and Spike Recovery (Two-Probe Approach)Conjugated and Unconjugated Mix Testing (Two-Probe Approach)

Table 3. A high concentration of the ASO drug was spiked into plasma and diluted 2-fold 4 times. The linearity of each dilution was assessed by comparing experimental signal to expected signal using the two-probe approach.
Table 4. The ASO drug was spiked into plasma at a high, mid, and low spike concentration. The recovery of each spike was assessed by comparing experimental signal to expected signal using the two-probe approach.
Control Recovery in Reproducibility Testing (Two-Probe Approach)

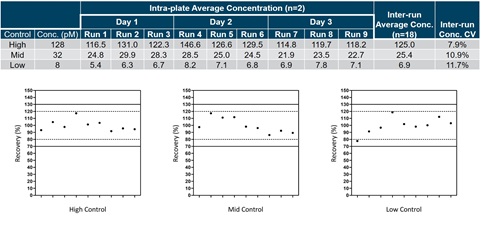
Figure 3. Controls were made at a high (128 pM), mid (32 pM), and low (8 pM) concentration prior to reproducibility testing. Three separate preparations of each control were run each day for a total of three days. The calculated concentrations were determined using the two-probe approach and the inter-run concentrations and concentration CVs were compiled across all three days of testing (Table). Each data point was also plotted and gated based on 20% (dotted line) and 30% (solid line) of experimental mean (Graphs).
Technical Overview and Calibration Curves (RPA)

Figure 2. Schematic for ASO detection via the one-probe RNase protection assay (RPA) (a) and comparison of calibration curves generated in buffer or human plasma (b).
Conjugated and Unconjugated Mix Testing (RPA)

Table 2. The unconjugated and conjugated forms of the ASO drug were mixed at different ratios to assess whether any conjugation bias was observed using RPA. The signals derived from the mixtures were compared to a 50/50 mix normalization.
Dilution Linearity and Spike Recovery (RPA)

Table 5. A high concentration of the ASO drug was spiked into plasma and diluted 2-fold 4 times. The linearity of each dilution was assessed by comparing experimental signal to expected signal using RPA.
Table 6. The ASO drug was spiked into plasma at a high, mid, and low spike concentration. The recovery of each spike was assessed by comparing experimental signal to expected signal using RPA.
Control Recovery in Reproducibility Testing (RPA)

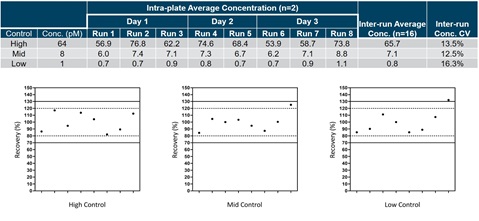
Figure 4. Controls were made at a high (64 pM), mid (8 pM), and low (1 pM) concentration prior to reproducibility testing. Two or three separate preparations of each control were run each day for a total of three days. The calculated concentrations were determined using RPA and the inter-run concentrations and concentration CVs were compiled across all three days of testing (Table). Each data point was also plotted and gated based on 20% (dotted line) and 30% (solid line) of experimental mean (Graphs).
Calibration Curve Reproducibility and LLOD / LLOQ Determinations (Two-Probe Approach)

Table 7. Three separate calibration curves were prepared and run across three days to assess the reproducibility of the two-probe approach. The inter-run average signal and signal CV were determined across the three days of testing. The lower limit of detection (LLOD) was determined using these calibration curves and 30 blank wells per plate. Based on these metrics, the estimated lower limit of quantification (LLOQ) was calculated.
Calibration Curve Reproducibility and LLOD / LLOQ Determinations (RPA)

Table 8. Two or three separate calibration curves were prepared and run across three days to assess the reproducibility of RPA. The inter-run average signal and signal CV were determined across the three days of testing. The lower limit of detection (LLOD) was determined using these calibration curves and 30 blank wells per plate. Based on these metrics, the estimated lower limit of quantification (LLOQ) was calculated.
Conclusion
These data highlight the utility of the N-PLEX platform for highly sensitive and reproducible ASO detection in plasma using 96-well plate processes that are amenable to high throughput testing.
Customer Service/Orders
Scientific/Technical Support
Instrument Support
Company Headquarters