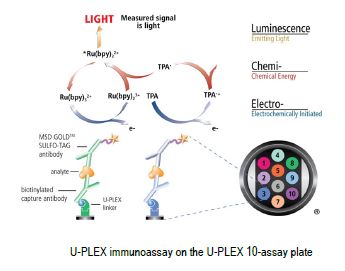
2. Methods
Biotinylated capture antibodies are coupled to one of ten unique U-PLEX linkers, which self-assemble onto unique spots on the U-PLEX plate. Analytes in the sample bind to the capture reagents; detection antibodies conjugated with MSD’s electrochemiluminescent (ECL) labels (MSD GOLD SULFO-TAG) bind to the analytes to complete the sandwich immunoassay (shown at right). Once the sandwich immunoassay is complete, the U-PLEX plate is loaded into the MSD instrument where a voltage applied to the plate electrodes causes the captured labels to emit light. The instrument measures the intensity of emitted light (which is proportional to the amount of analyte present in the sample) and provides a quantitative measure of each analyte in the sample.
3. Screening for Viable Antibody Pairs Using the U-PLEX Platform
Unbiased screening of 59 antigen-specific antibody pairs on the U-PLEX platform. Pair-wise combinations of all antibodies labeled with biotin or MSD GOLD SULFO-TAG were evaluated for their ability to produce robust signal in the presence of calibrator and low signal in the absence of calibrator (diluent only). Shown is a heat map of selected signal data from this study arranged to allow visualization of antibody pairs that generated the highest signals. Green represents pairs with the highest signals, yellow represents pairs with signal in the 50th percentile and red represents pairs with low or no signal. Thirty-eight antibody pairs were selected from this screen based on high signal and low background (data not shown) for continued screening.

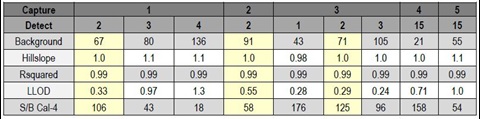
4. Secondary Screening of Selected Antibody Pairs on the U-PLEX Platform
Secondary screening on the U-PLEX platform was used to evaluate full standard curves of 38 selected antibody pairs. The table (far left) summarizes the results from secondary screening of selected antibody pairs. Individual hillslopes, lower limit of detection (LLOD), and signal to background ratio at Cal-4 are tabulated. A total of nine antibody pairs with desirable background signals, sensitivity, and hillslope were selected (highlighted in yellow). Standard curves for selected assays are graphically displayed (near left) demonstrating that all assays have broad dynamic range across several logs of signal.

5. Sample Testing
Sample testing was performed on the U-PLEX platform. Concentrations of analytes detected by each proposed antibody pair are shown at left. Relevant standard curve values for each antibody pair are shown below, including LLOD (selected pairs are highlighted in yellow). The nine selected antibody pairs were evaluated for their ability to detect analyte in 12 different stimulated samples. Stimulated samples were used because the analyte is not present in normal matrices. Full standard curves and stimulated samples were run in duplicate. All pairs were able to detect analyte in samples 2, 5 and 7. Three pairs (highlighted by red arrows) were selected based on best reactivity to samples and overall assay sensitivity.

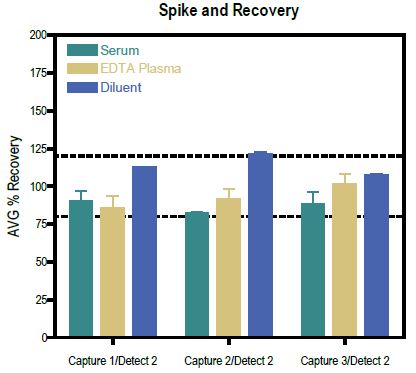
6. Matrix Tolerance
Three antibody pairs from the original nine were selected to evaluate matrix tolerance on the U-PLEX platform. Spike recovery (at left) was evaluated by spiking normal human serum (n=3) and EDTA plasma (n=3) from a commercial source or diluent with calibrators at three different levels (high, mid, and low). All three antibody pairs were found to recover within 20%of the targeted range. Dilution linearity was also assessed by spiking normal human serum (n=3) and EDTA plasma samples (n=3) and diluent (n=3) with recombinant calibrator and diluting 2-, 4-, 8-. and 16-fold before testing (data not shown). The average percent recovery was based on samples that measured within the quantitative range of each assay. All three antibody pairs were found to recover within 20% of the targeted range, suggesting that the samples dilute linearly 2- to 16-fold. Overall, the data suggest that the three selected antibody pairs were not sensitive to matrix effects. Of these three viable antibody pairs, Capture 1/Detect 2 and Capture 2/Detect 2 were selected for optimization.
7. Assay Range
The assay range for one selected antibody pair (Capture 1/Detect 2) was characterized. A twelve point standard curve was prepared with an initial top of curve concentration of 40,000 pg/mL. The standard curve for the proposed primary antibody pair is shown (far left). The antibody pair demonstrated 3- to 4-logs of dynamic range. The table (near left) shows the signals and %CVs of each point in the proposed primary assay standard curve.

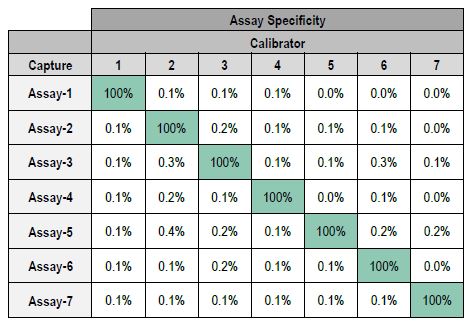
8. Assay Specificity
The selected assay pair (Capture 1/Detect 2) was multiplexed with six additional assays to evaluate calibrator/antibody specificity. In this study, the capture antibody for each assay was linked to individual spots in wells on the U-PLEX plate and tested with individual calibrators and a blended detection antibody solution. Data demonstrated that non-specific binding (non-specific binding signal/specific signal X 100) was less than 0.5% for all of the assays. Overall, the data indicated that the new selected antibody pair can be successfully multiplexed with six additional assays to form a potential U-PLEX panel.
9. Conclusion
We demonstrated the utility of the MSD U-PLEX platform for the rapid screening and selection of viable antibody pairs from over 3,000 potential antibody combinations. The platform was subsequently used to select and optimize multiple antibody pairs based on parameters such as dynamic range, sensitivity, sample recognition, matrix tolerance, and non-specific binding. These studies demonstrated that the U-PLEX platform can be adapted to facilitate both large and small immunoassay development programs.