2. Methods
MSD’s electrochemiluminescent detection technology uses SULFO-TAG labels that emit light upon electrochemical stimulation initiated at the electrode surfaces of MULTI-ARRAY and MULTI-SPOT microplates.
Electrochemiluminescence Technology

- Minimal non-specific background and strong responses to analytes yield high signal-to-background ratios.
- The stimulation mechanism (electricity) is decoupled from the response (light signal), minimizing matrix interference.
- Only labels bound near the electrode surface are excited, enabling non-washed assays.
- Labels are stable, non-radioactive, and directly conjugated to biological molecules.
- Emission at ~620 nm eliminates problems with color quenching.
- Multiple rounds of label excitation and emission enhance light levels and improve sensitivity.
- The carbon electrode surface has a 10X greater binding capacity than polystyrene wells.
- Surface coatings can be customized.
3. Biomarkers Assay Development & Typical Performance
MSD developed 18 assays against host biomarkers and an assay against the VEEV E2-ectodomain protein. Inflammatory cytokine assays such as for IFNγ, IL-6, IP-10, MCP-1, TNFα, RANTES, MIP-1α, IP-10, IL-1α, IL-1β, MMP-9, and PDGFR-β were developed to follow the lymphatic stage of infection. Brain injury marker (S100B, GFAP, UCH-L1, NfL, ICAM-1, and Tau) assays may be used to assess the encephalitic stage of VEEV infection. Assays against the VEEV E2-ectodomain protein are designed to detect the viremia stage of VEEV infection.
The assays were combined into five multiplexed panels (Table 1) and formulated as kits containing 96-well MULTI-SPOT 10-spot plates, calibrators, controls, detection antibody solutions, diluents, and read buffer. The assays were run following the 2-step protocol shown below and used to test against NHP serum, plasma, and CSF samples collected during vaccination and infection studies.
Protocol at Glance
Add calibrator, control, or sample (50 µL/per well). Incubate 1 hour at room temperature (RT).
Wash and add detection antibody solution (50 µL per well). Incubate 1 hour at RT.
Wash and add read buffer (150 µL per well). Analyze with MSD instrument

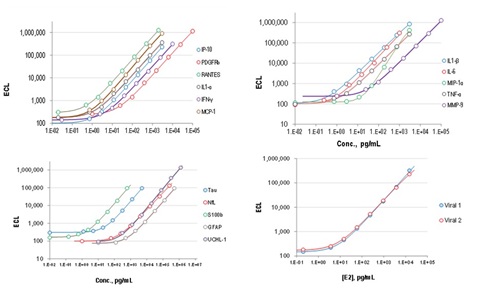
Figure 1. Typical calibration curves for MSD host biomarker and viral assays tested in this study.

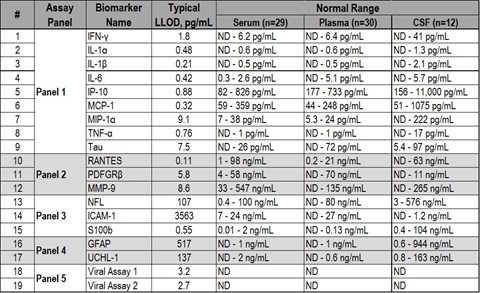
Table 1. Concentration ranges of biomarkers measured in non-vaccinated and non-infected animals. Normal ranges are based on samples collected from 3 vaccinated animals prior to vaccinations and from 3 non-vaccinated animals prior to viral challenge. Non-detectable values are marked as ND.
4. Vaccination and Infection Study: Animal Handling & Sample Collection
All animal handling procedures were conducted in accordance with the UB Institutional Animal Care and Use Committee-approved protocols. Six cynomolgus macaques (Macaca fascicularis) (NHPs) weighing between 2.9-3.4 kg were screened by hemagglutination testing to be free of prior infection with alphaviruses (i.e., Venezuelan and eastern equine encephalitis, Sindbis, Semliki Forest, and chikungunya viruses) as well as simian immunodeficiency virus, simian type D retrovirus and simian T-lymphotropic virus. The NHPs were housed individually in open metal caging, allowing visual contact with other NHP in the room. A standard primate chow and fresh fruits and vegetables were provided daily. Following restraint via the cage-squeeze mechanism, an intramuscular injection of ketamine hydrochloride for anesthetization was given prior to collecting blood samples, vaccination, or challenge.
Vaccination: On Day 0, three out of six animals were vaccinated subcutaneously in the right leg with approximately 0.5 mL of VEEV-IRES vaccine at a titer of approximately 4.0x10⁴ plaque-forming units (PFU) per mL. No signs of disease or distress were noted following vaccination.
Infection: On Day 42 after vaccination, the animals were challenged by the aerosol administration of approximately 105 PFU, or 100 infectious dose 50% (ID50) units of cDNA clone-derived VEEV epizootic/epidemic subtype IAB strain Trinidad donkey (TrD). A head-only, 16-liter dynamic inhalation aerosol exposure using the Biaera Aero3G delivery system was used to challenge each NHP. Collison nebulizer and all-glass impinger samples were used to determine actual infectious doses received by each NHP. For unknown reasons, animals received infectious doses of 3.5 x 10⁴ to 9.1 x 10⁴ PFU, which was smaller than the expected 105 to 106 PFU dose.
Sample Collection: Blood samples were collected on Day 0 prior to vaccination and on Days 1, 2, 3, 4, 7, and 28 post-vaccination. On the day of viral challenge (Day 42) blood was collected prior to the challenge and also on Days 43, 45, 46, 49, and 62. Blood samples were taken by venipuncture of the inguinal vein. Serum and plasma were separated, transferred to cryovials, and maintained at -80 °C for later analyses. CSF was also collected via lumbar puncture from six animals (3 vaccinated, 3 sham-vaccinated) on Days 7 and 28 after vaccination as well as Days 42, 49, and 62 (Days 1, 7, and 20 after challenge).
5. Biomarker Responses to Vaccination
Table 2. Changes in circulating levels of biomarkers in serum during the post-vaccination period in vaccinated (top table) and non-vaccinated (bottom table) animals. Concentration values for each animal were normalized to pre-vaccination measurements taken on the day of vaccination (Day 0). Data from matching plasma samples (not shown) exhibited similar trends. Significant increases in circulating levels of IFNγ, IL-6, MCP-1, and IP-10 were observed in all animals after vaccination
6. Biomarker Response to Infection
Table 3. Changes in circulating levels of biomarkers in serum during the post-challenge period in vaccinated (top table) and non-vaccinated (bottom table) animals. Concentration values for each animal were normalized to pre-challenge measurements taken on the day of the aerosol viral challenge (Day 42). Data from matching plasma samples (not shown) exhibited similar trends. Vaccinated animals did not show significant increases in the concentration of any biomarkers after the aerosol viral challenge. The majority of non-vaccinated animals showed significant increases in IFNγ, IL-6, MCP-1, IP-10, and NfL levels in response to a viral challenge event.
7. Selected Biomarker Concentration Profiles

Significant increases in NfL levels in two animals during the vaccination and post-vaccination periods were linked to an altercation between one of the vaccinated and one non-vaccinated animals. Based on veterinary notes, the non-vaccinated animal suffered more damage than the vaccinated animal, which could be traced by significantly higher levels of NfL in the former animal’s samples. NfL levels dropped to the normal level in both animals before viral challenge (Day 42).
8. Ultra-Sensitive E2-ectodomain protein Assay
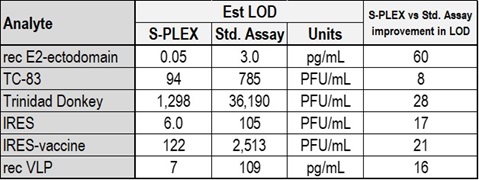
The standard MSD viral assays that we developed were capable of detecting the VEEV E2-ectodomain protein during the viremia stage (see assays Viral 1 & 2 in Table 4). However, in some tested animals, viral assay responses were relatively low. Significant improvement in E2-ectoprotein assay sensitivity was observed with an optimized antibody pair and using the ultra-sensitive S-PLEX MSD platform.
Figure 3. Typical calibration curve of VEEV E2-ectodomain protein on MSD S-PLEX platform.

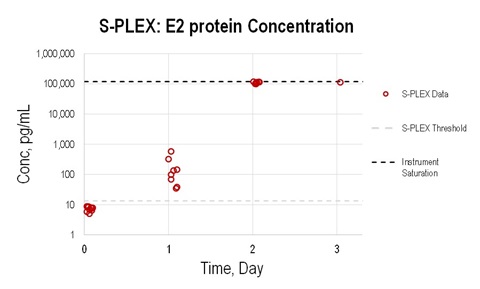
Figure 4. Concentrations of VEEV E2-ectodomain protein in A129 mice during TC-83 infection. Concentrations were estimated based on the calibration curve shown in Figure 3. 50-fold diluted samples were used

Table 4. Typical limits of detection for standard and S-PLEX MSD assays for VEEV E2-ectoprotein and different strains of VEEV.
A small study of TC-88 VEEV in mice was performed to test the utility of the developed viral assay to measure viral load and the concentration of E2-ectoprotein in infected mice. Briefly, eight Type I interferon receptor knockout mice (strain A129) were used in the study. The A129 mouse, lacking the interferon type I receptor, is more susceptible to viral infection in vivo, yielding high titer viremia.
A129 mice were injected subcutaneously with 104 PFU of TC-83 virus. Blood was collected on Days 0 (prior to infection), 1, and 2, and from the only one surviving mouse on Day 3. Serum samples were separated and tested on the S-PLEX E2-ectodomain protein assay. Due to limited sample volumes (approximately 40 μL per sample), samples were diluted 50-fold in MSD sample diluent. The S-PLEX assay consistently detected E2-ectoprotein in the mouse blood samples on Day 1 after infection even at 50X (see graph) and 500X (data not shown) dilutions.
9. Conclusions:
- Significant increases in circulating levels of IFNγ, IL-6, MCP-1, and IP-10 were observed in all animals after vaccination.
- Vaccinated animals did not show significant increases in the concentration of these biomarkers after aerosol viral challenge. These findings suggest that the proposed biomarkers could be valuable tools in vaccine efficacy studies.
- The majority of non-vaccinated animals showed significant increases in IFNγ, IL-6, MCP-1, IP-10, and NfL levels in response to a viral challenge event. These biomarkers had different time profiles in response to viral challenge. Concentrations of IFNγ, IL-6 and MCP-1 peaked on Day 1 after challenge and decreased to pre-challenge level after 3–4 days. An elevated IP-10 concentration as a response to viral challenge persisted till Days 4–5, while NfL levels peaked on Days 5–7 and remained slightly elevated even after 20 days post-challenge. Different response times of these biomarkers could be useful for development of a “time-from-exposure” algorithm.
- An ultra-sensitive assay for the VEEV envelope protein (E2-ectodomain protein) was developed and could become a valuable tool for detection of VEEV viremia.
- The approaches described in this poster could be used for developing biomarker panels for other viral infections including, but not limited to, filoviruses, flaviviruses and other alphaviruses.
10. Future Directions:
The biomarkers of VEEV infection identified in this study will be measured in a near real-time NHP study using assays in MSD’s cartridge based platform.
11. Acknowledgements:
Some of the antibodies and calibrator materials used for development of VEEV E2-ectodomain protein assay were provided by Dr. Michael Diamond (Wash. University, St. Louis, MO).
Effort sponsored by the US Government under Other Transaction number W15QKN-16-9-1002 between the MCDC, and the Government. The US Government is authorized to reproduce and distribute reprints for Governmental purposes notwithstanding any copyright notation thereon. The views and conclusions contained herein are those of the authors and should not be interpreted as necessarily representing the official policies or endorsements, either expressed or implied, of the US Government.